Admin
A PostgreSQL DBA console: real-time process list, lock monitor, table maintenance, settings viewer, role manager, backups. The kind of work that usually lives in pgAdmin or Datadog Database Monitoring, here in one tab.
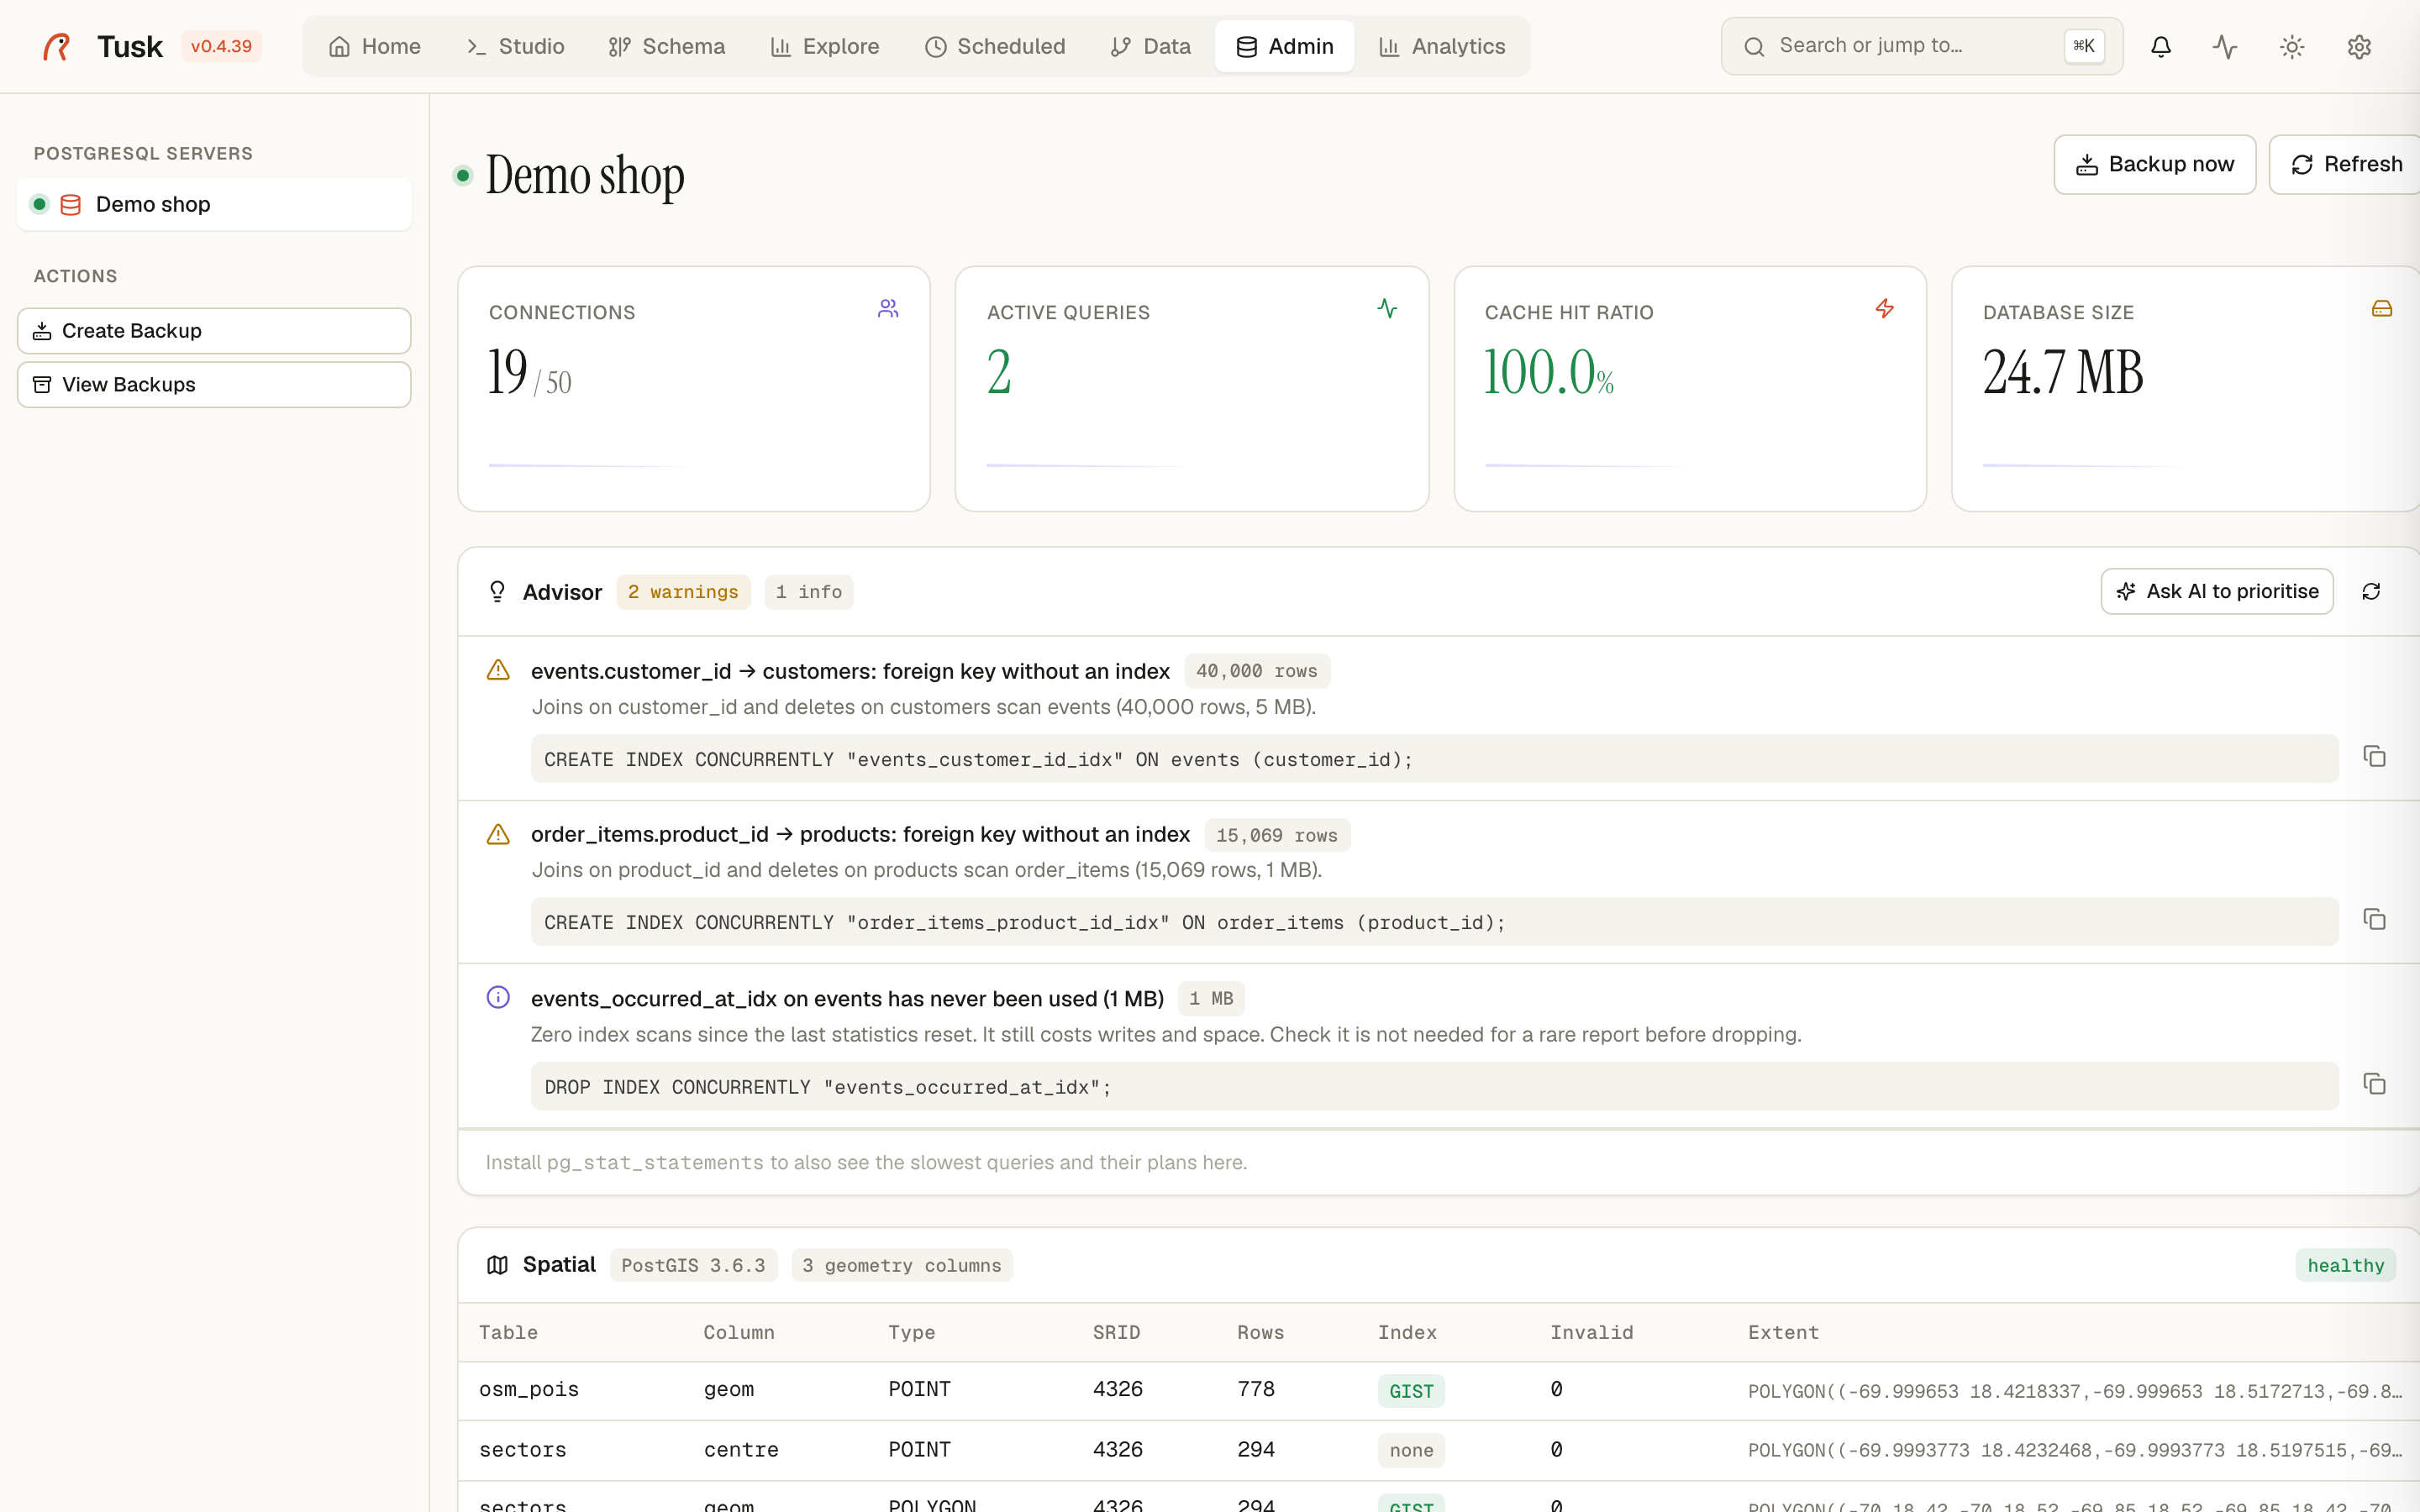
Admin — Postgres console with processes, locks, settings, backups.
Top-bar stats (per connection)
For the active Postgres connection, four KPI cards:
| Card | Source | Meaning |
|---|---|---|
| Connections | pg_stat_activity count vs max_connections |
How saturated the connection pool is. Yellow at >70%, red at >90%. |
| Active queries | pg_stat_activity where state = 'active' |
How many queries are in flight right now. |
| Cache hit ratio | pg_stat_database.blks_hit / (blks_hit + blks_read) |
The single best Postgres health number. Sustained <90% means your working set doesn't fit in shared_buffers — time to look at indexes or RAM. |
| Database size | pg_database_size(...) |
Total disk footprint. |
Refresh re-polls all four. Backup now jumps to the Create Backup dialog (see Backups below).
Active processes
A live table of every row in pg_stat_activity that isn't your own connection. Each row:
- PID + status dot (green = active, amber = idle / idle-in-tx, gray = waiting).
- Database name chip.
- Query text (truncated to ~80 chars; click to expand).
- Duration (how long since
query_start). - State badge —
active,idle in tx,idle,waiting, etc. - A Kill button (right side, red) that runs
pg_terminate_backend(pid)after confirmation.
Filters above the table let you narrow by user (Filter user…) or database (Filter db…) — useful on shared instances where you only want to see your own app's connections.
Lock monitor
Shows blocking lock chains derived from pg_locks + pg_stat_activity. When something is blocked-waiting, the offending lock holder shows up here.
If the connection itself is unreachable (e.g. the SSH tunnel is down because the bastion's Security Group dropped your IP — post-mortem), the lock monitor renders an inline error banner instead of a perpetual spinner:
⚠️ Lock monitor error
ssh_tunnel: bastion <ip> marked unreachable (...); will retry in <30s
Same banner pattern is used everywhere: Active Processes, Table Maintenance, Extensions, Settings — every panel that needs the database. The contract is "never leave a panel spinning".
Table maintenance
Per-table view of bloat + maintenance recency. Columns:
- Table (
schema.name). - Size (
pg_relation_size). - Dead tuples (
n_dead_tupfrompg_stat_user_tables). - Bloat % (estimated from dead-tuple-to-live-tuple ratio).
- Last vacuum / Last analyze (relative time).
- Actions: VACUUM (regular), VACUUM FULL, ANALYZE, REINDEX. Each runs in a background job (job watchdog caps it at 1h so a stuck operation doesn't tie up a worker).
Extensions
Lists every extension from pg_available_extensions, marking which are currently installed. Install / uninstall via one-click buttons (admin auth required). Show available toggles between "only installed" and "all available".
Database settings
Reads pg_settings. Each row: setting name, current value, default, category, description, and an action to override (where context = user or superuser). For restart-context settings, the UI shows a "requires restart" badge.
Filter… does a substring match across name + description. Show all flips between the curated "important" subset (~30 settings DBAs actually look at) and the full ~300-row list.
Scheduled tasks
Cron-style jobs scoped to this connection. Add with + Add Schedule. Each row shows:
- Job name / description
- Cron expression (
*/15 * * * *) - Status: active / paused
- Last run + duration
- Next run
Backed by the same APScheduler instance the whole studio uses. Background work is bounded by per-kind max_duration_s defaults — see tusk.core.jobs.
Roles & Users
The Postgres native side of access control (different from the application-level RBAC in tusk-bi). Lists pg_roles, lets you create / drop / alter login / superuser / replication / connection_limit. Each row:
- Role name
- Login (yes/no)
- Superuser (yes/no)
- Create DB / Create Role flags
- Member-of (parent roles)
- Actions menu
Backups
Backup now opens a dialog that shells pg_dump -F c | gzip to a file in ~/.tusk/backups/<conn>/<timestamp>.sql.gz. The actual dump runs in a background job (the route returns 202 + job_id immediately so the UI never freezes). Progress streams to the global activity drawer.
Backups visible in the View backups panel show three states:
- Verified (green) — sidecar metadata says the dump completed cleanly.
- Empty (red) — the file is < 100 bytes; pg_dump silently produced nothing (typically a client/server version mismatch). Post-mortem here.
- Unverified (neutral) — file exists but no sidecar metadata (older backups from before v0.4.10).
Restore: Restore... lets you pick a backup file + target connection. Cross-connection restore is supported (you can dump prod and restore into a local staging connection for diagnostics).
For backups through an SSH tunnel (RDS behind a bastion), see the SSH-tunnel section in deployment — it works transparently, the tunnel is auto-resolved before pg_dump is invoked.
Why Admin matters
The pitch is "one tab, every common PG admin task". pgAdmin is a desktop app. Datadog DB Monitoring is paid and remote. Tusk Admin is what your home-grown internal admin page would have been if you had three months to build it — except it already exists.
SSH tunnels
Every Postgres connection can optionally route through an SSH bastion. The tunnel manager: - Reuses one asyncssh session across multiple connections that share a bastion (single handshake instead of N). - Caches "broken bastion" state for 30s after a failed handshake so a flood of admin polls doesn't each pay a fresh 10s timeout. - Surfaces unreachable bastions inline in the affected admin panel, not as a generic 500.
See bugs/2026-05-18-ssh-tunnel-hangs-admin.md for the post-mortem on the day the tunnel cache wasn't doing those things.
Related
- studio.md — the "Query in Studio" buttons across Admin panels target this.
- analytics.md — for dashboard-style monitoring views rather than the live process list.
Advisor
The Advisor card reads the catalog and the statistics views and lists what a DBA would fix first, each with the statement to run and a copy button. Nothing is applied for you.
- Foreign keys without an index (joins and cascading deletes scan the table).
- Tables scanned sequentially far more often than by index, with their size.
- Indexes never used since the last statistics reset, by size.
- Duplicate indexes on the same columns.
- Dead tuples piling up (autovacuum not keeping up).
- Big tables that were never analysed.
- With
pg_stat_statements: the slowest queries by total time, and the sequential scans their generic plan shows (PostgreSQL 16+).
Ask AI to prioritise sends the report (not your data) to the configured
model and gets a two-paragraph reading with an ordered list of actions.
Agents get the same report through the MCP tool advise.
Spatial (PostGIS)
When the database has PostGIS, a Spatial card lists every geometry column with its type, SRID, approximate row count, whether it has a spatial index, how many geometries are invalid (checked on a sample) and its extent. Findings come with the statement to run:
- a big table without a GIST index (
CREATE INDEX CONCURRENTLY … USING GIST); - SRID 0 (
UpdateGeometrySRID); - invalid geometries (
ST_MakeValid).