Studio
The SQL editor. This is where the work happens.
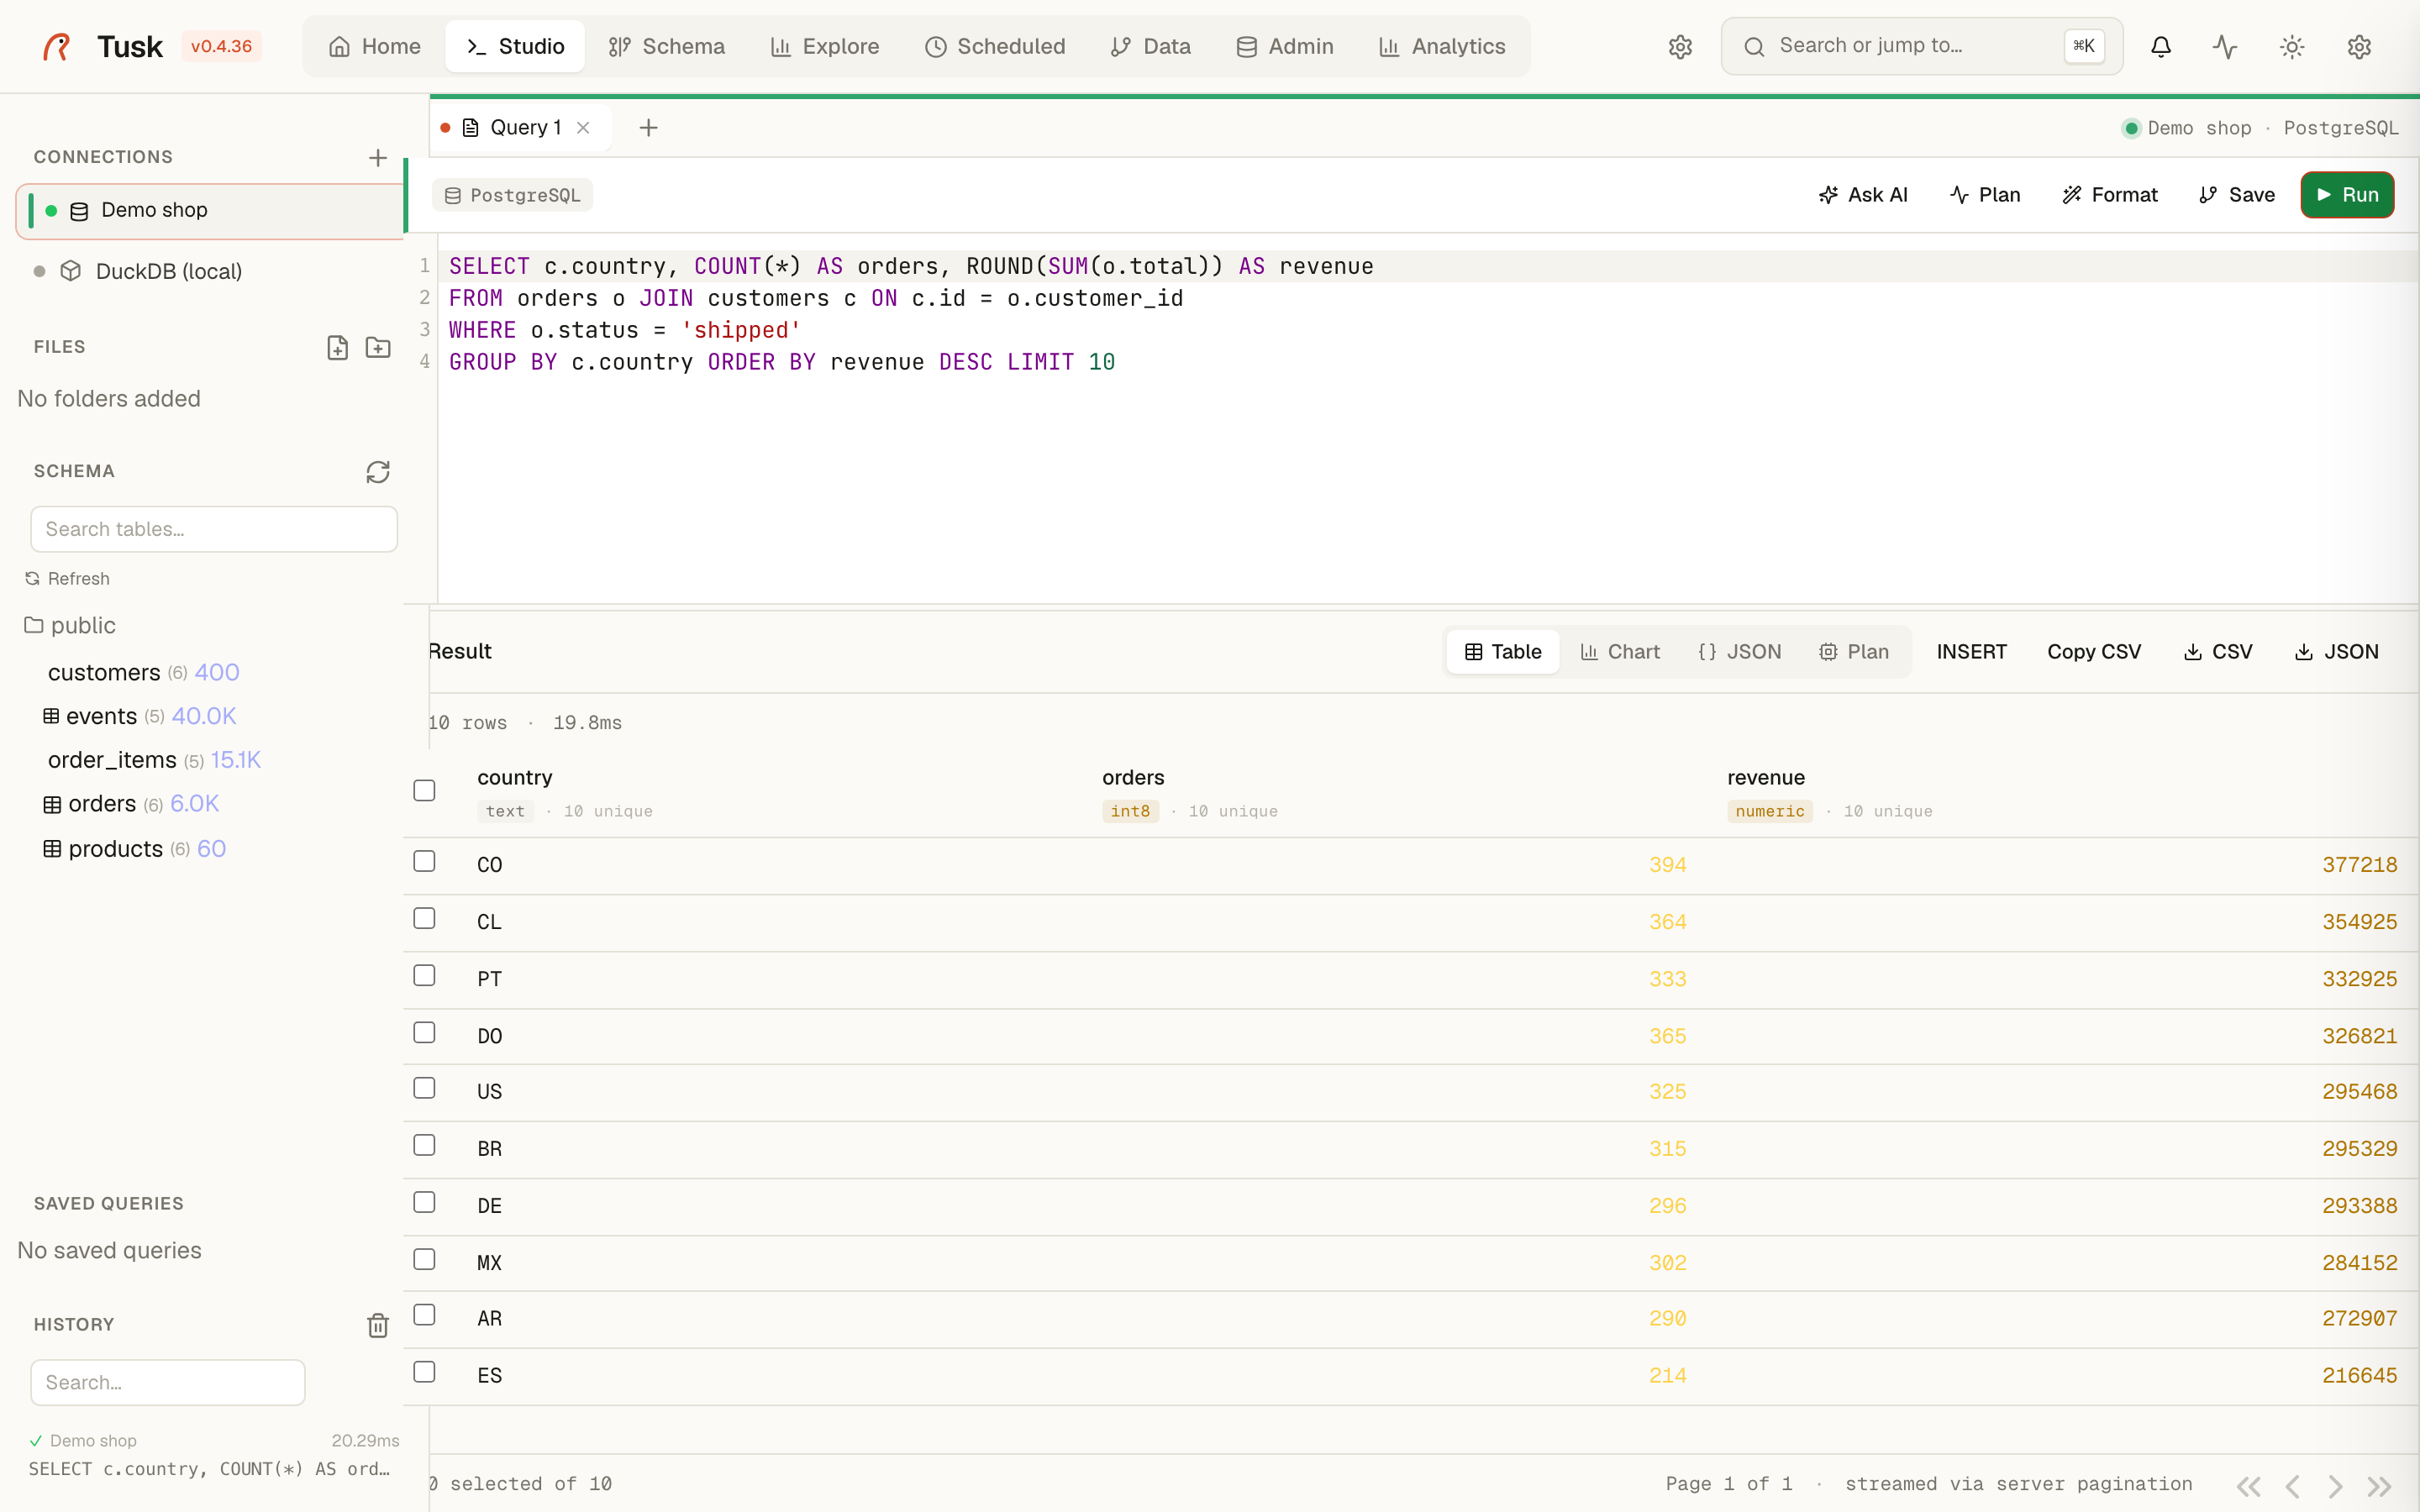
Studio — SQL editor with results table, connection sidebar.
Layout
A three-column workspace with a top tab bar:
┌─────────────────────────────────────────────────────────────────┐
│ [Tusk]  Home  Studio  Schema  Explore  Scheduled  Data  Admin   │
├─────────────────────────────────────────────────────────────────┤
│ [Query 1] [History 20] [History 21] [+]              ● <conn>   │  ← tab bar
├──────────┬──────────────────────────────────────────────────────┤
│ CONNS    │ [PostgreSQL]      Ask AI · Plan · Format · Save · Run│
│ ● db-1   │  1  SELECT * FROM regions                            │  ← editor
│ ● db-2   │                                                       │
│ ● db-3   │                                                       │
├──────────┼──────────────────────────────────────────────────────┤
│ FILES    │ Result · 14,262 rows · 3.1ms                          │  ← results
│          │ [Table] [Map] [Chart] [JSON] [Plan]    Copy CSV  …    │
│ SCHEMA   │ id    level  code     name              latitude      │
│ — table1 │ ...   ...    ...      ...               ...            │
│ — table2 │                                                       │
└──────────┴───────────────────────────────────────────────────────┘
The tab bar
Multiple queries open simultaneously, browser-style. Each tab carries its own:
- SQL text + cursor position
- Selected connection
- Last-run timestamp + row count
- "Dirty" indicator (orange dot) when unsaved changes vs the last run
The right side of the bar shows the active connection chip with a colored dot — green for healthy, amber for connecting, red for failed. Click it to pick a different connection without leaving the tab.
The connections sidebar
Lists every configured Postgres + DuckDB source in your ~/.tusk/connections.toml. Each row:
- A status dot (green = pool healthy, amber = idle but reachable, red = failure).
- The connection name.
- An icon: database for Postgres, box for DuckDB, folder for file-based sources.
Right-click any connection for: Test connection · Reconnect · Edit · Remove.
Below it the Files section is a workspace bookmark area (drag a .sql file in to save it).
The schema panel (bottom-left)
When you select a table in the sidebar's Schema panel, the editor gets context — autocompletion knows the columns, AI Copilot grounds in the schema, and Format respects the table's column casing.
The schema panel itself is a live introspection of the connected database — not a cached snapshot. When the schema drifts (a column is renamed remotely), the next query refresh pulls the new shape and Copilot flags the drift in its suggestions.
The editor
Monaco-based (the VS Code engine). Features:
- Syntax highlighting for PostgreSQL flavor SQL.
- Autocomplete of table names, column names, function names from the connection's introspected schema.
- Inline lint markers for syntax errors as you type.
- AI Copilot (
Ask AIbutton) opens a side panel that takes natural language and emits SQL grounded in the active schema. PlanrunsEXPLAIN ANALYZEagainst the current SQL and renders the plan tree (no execution against your actual data).Formatprettifies SQL via a server-side pgfmt-ish formatter.- Keyboard:
⌘+Enterruns,⌘+Ssaves,⌘+/toggles comment.
Results
Five render modes, switchable without re-running the query:
| Mode | When to use |
|---|---|
| Table | Default. Sortable columns, sticky header, server-side pagination for large results (you only fetch the rows you scroll to). |
| Map | Auto-detected when the result has lat / lng columns (or a PostGIS geometry). MapLibre tile renderer with optional bubbles mode. |
| Chart | Auto-suggests chart type based on column shapes (categorical x + numeric y → bar; time x + numeric y → line). |
| JSON | Raw result as JSON for copy/paste / debugging. |
| Plan | If you ran EXPLAIN ANALYZE, shows the parsed plan tree. |
Above the table: INSERT (writes a new row via a generated form), Copy CSV, CSV download, JSON download.
The header strip notes how many rows came back, how long it took, and whether the result was streamed via server pagination (for >10K rows) vs fetched whole.
History
Every query you run lands in ~/.tusk/history.db. The bottom of the connections sidebar shows the last 50, searchable. Click any to reopen.
Why Studio matters
Most tools force you to commit to a connection or a saved query. Studio's bet is that fast iteration beats organization: open a tab, write SQL, run, look at results in three different modes, copy to a new tab, edit, run. The history table is the safety net — every iteration is recoverable.
Keyboard reference
| Key | Action |
|---|---|
⌘+Enter |
Run current query |
⌘+T |
New tab |
⌘+W |
Close current tab |
⌘+S |
Save query (named) |
⌘+K |
Open command palette (jump to any feature) |
⌘+/ |
Toggle comment |
Esc |
Close AI Copilot panel |
Related
- home.md — the "New query" button lands here.
- schema.md — for understanding the schema this editor autocompletes from.
- analytics.md — save a query as a dashboard widget.
Connection colour
Give a connection a colour when you add or edit it (red for production, amber for staging, green for development — or any of the presets). The colour tints the tab strip and the editor header, marks the active-connection badge and stripes the connection list, so a production tab never looks like a development tab. Colours are stored with the connection.
Preview a table
Every table in the schema tree has a PREVIEW action: it opens a new tab
with SELECT * FROM … LIMIT <cap> and runs it. The cap (200 rows by
default) lives in Settings → Studio, which keeps an accidental click on
a 50M-row table cheap. Double-click still inserts the table name at the
cursor; INSERT still opens an insert template.
Read a plan
The Plan tab draws EXPLAIN as a tree of cards: node type, the table
or index and the condition, estimated rows and the node's own cost, with a
bar for its share of the whole plan (children excluded). The costliest
node is highlighted; a sequential scan over many rows is flagged.
Analyze runs the query and adds real rows and times, marking the
nodes where the planner's estimate was far off. JSON shows the raw
plan.
Explain a plan with AI
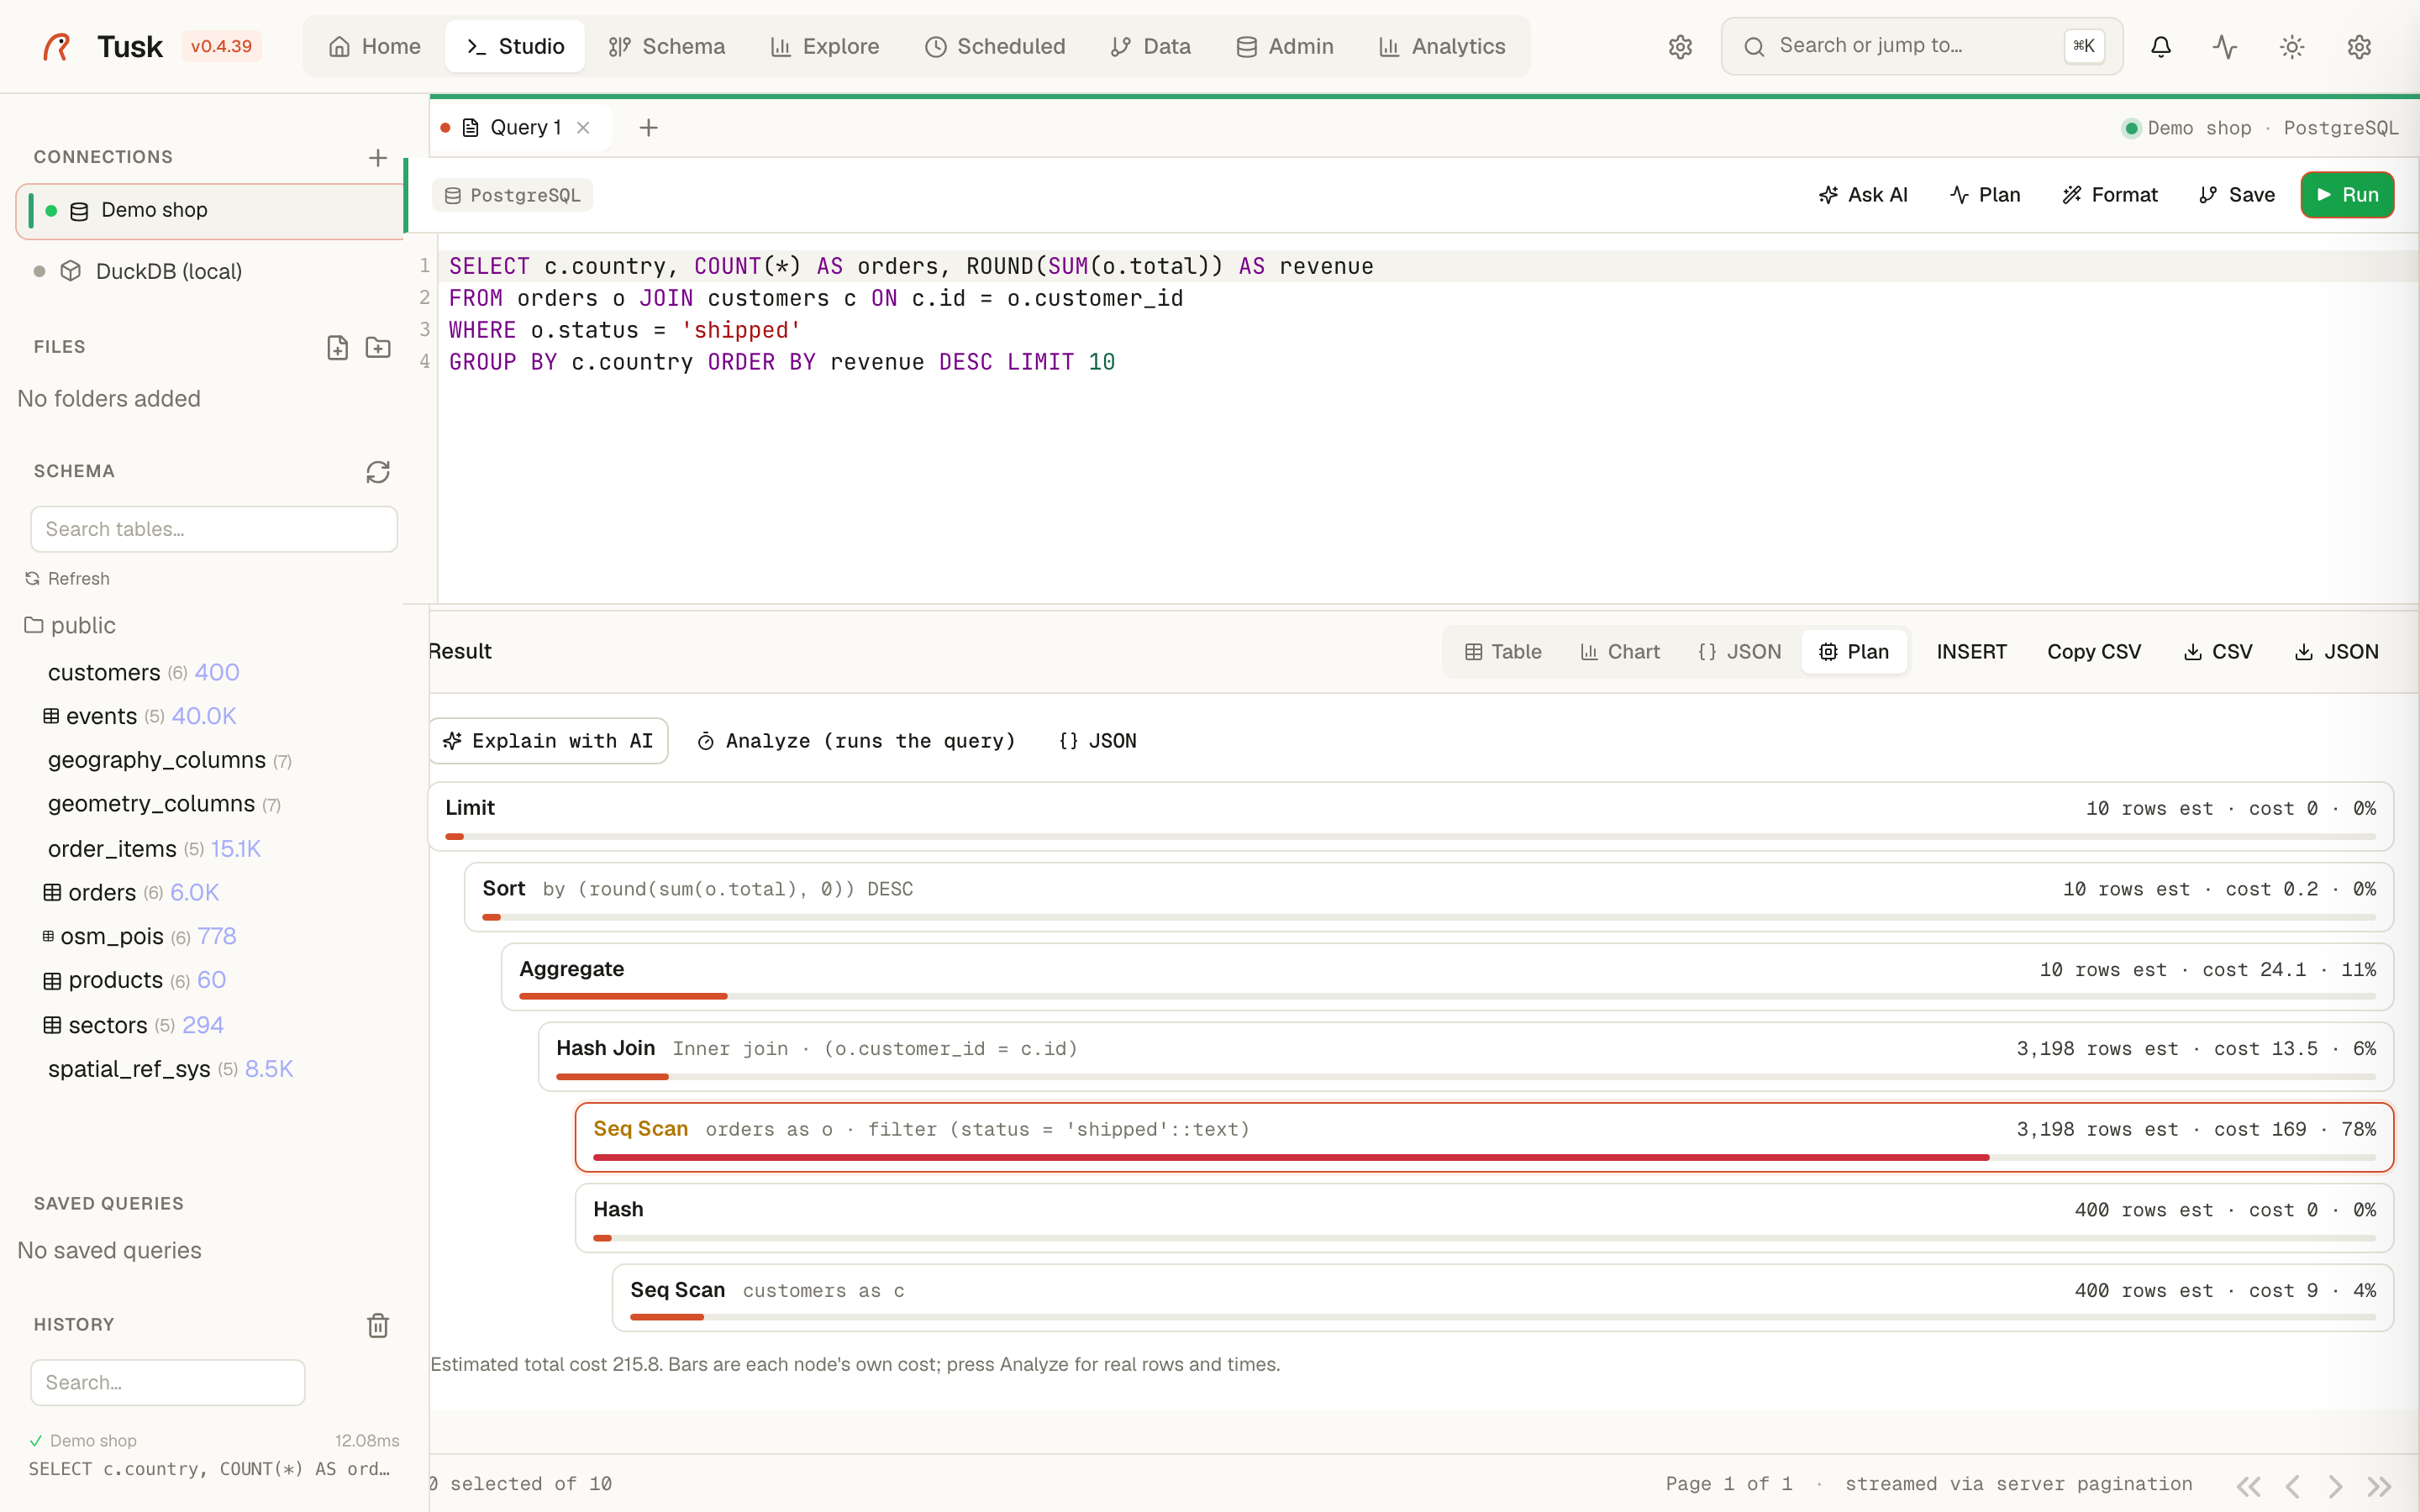
In the Plan tab, Explain with AI sends the EXPLAIN output together
with the SQL and the schema the Copilot already grounds on. You get a
short summary of what the planner does, the nodes that dominate the cost
and ordered suggestions — an index with its columns, a rewrite, ANALYZE,
a configuration knob — or a plain "this plan is fine". It uses the same
provider as the rest of the Copilot (Settings → AI Copilot).
Studio settings
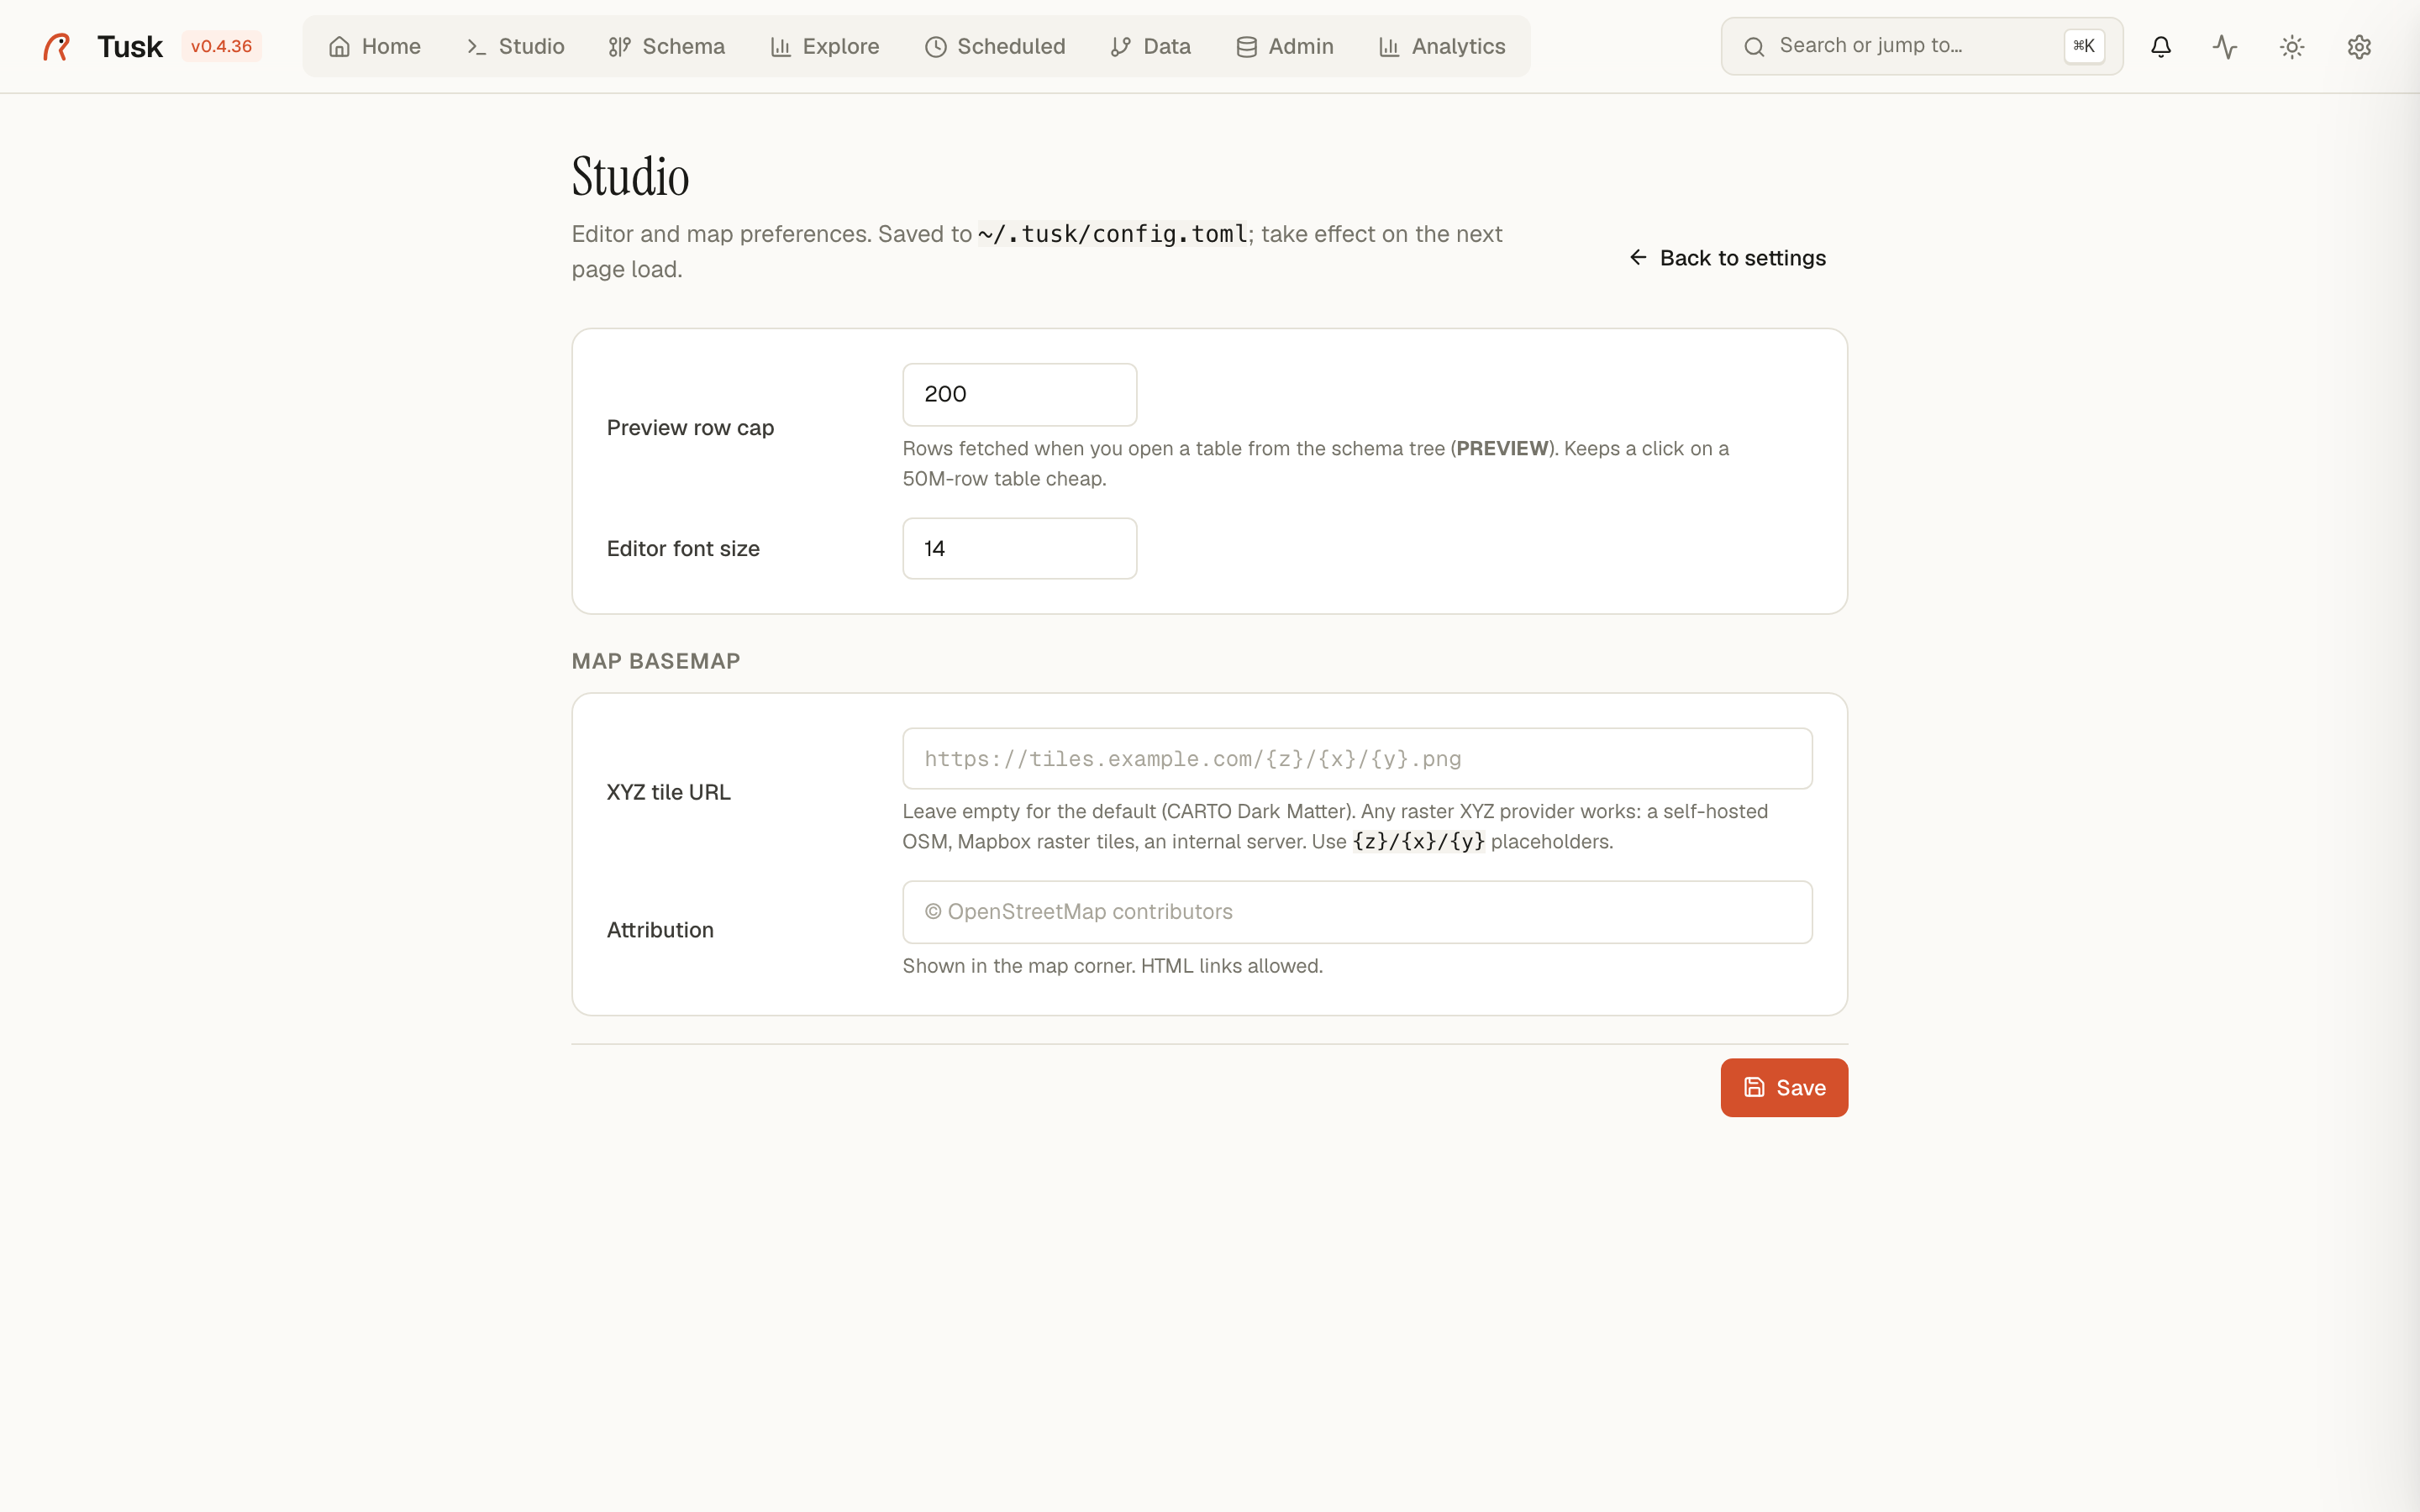
Settings → Studio holds the preview row cap, the editor font size and
a custom XYZ basemap for the map views (URL with {z}/{x}/{y} placeholders
plus attribution) — a self-hosted OSM, Mapbox raster tiles or an internal
tile server instead of the default OpenFreeMap basemap (keyless vector tiles, light or dark to match the theme).
Saved queries as vector tiles
A saved query with a geometry column can be served as Mapbox Vector Tiles (the layers button next to a saved query copies the URL):
GET /api/tiles/<query id>/tilejson             # TileJSON: tiles URL, bounds, fields
GET /api/tiles/<query id>/{z}/{x}/{y}          # one tile, straight from ST_AsMVT
Point a MapLibre vector source at the TileJSON and every non-geometry
column of the query is a feature property, layer name query. The query
runs inside ST_AsMVT per tile — no GeoJSON export, no copy, always the
current data. Read-only queries on PostgreSQL connections only. In
multi-user mode append ?token=tusk_… (Profile → API tokens); tile
requests cannot carry headers.
map.addSource('shops', { type: 'vector', url: 'https://tusk.example.com/api/tiles/12/tilejson?token=tusk_…' });
map.addLayer({ id: 'shops', type: 'circle', source: 'shops', 'source-layer': 'query' });
Deep links
/studio?connection=<id>&sql=<sql>&map=1&title=<name> selects the
connection, opens the SQL in a new tab, runs it and switches to the map
view. Add run=0 to only open the tab. The Open in map buttons on the
Spatial cards (Admin, Explore) use it.