Analytics
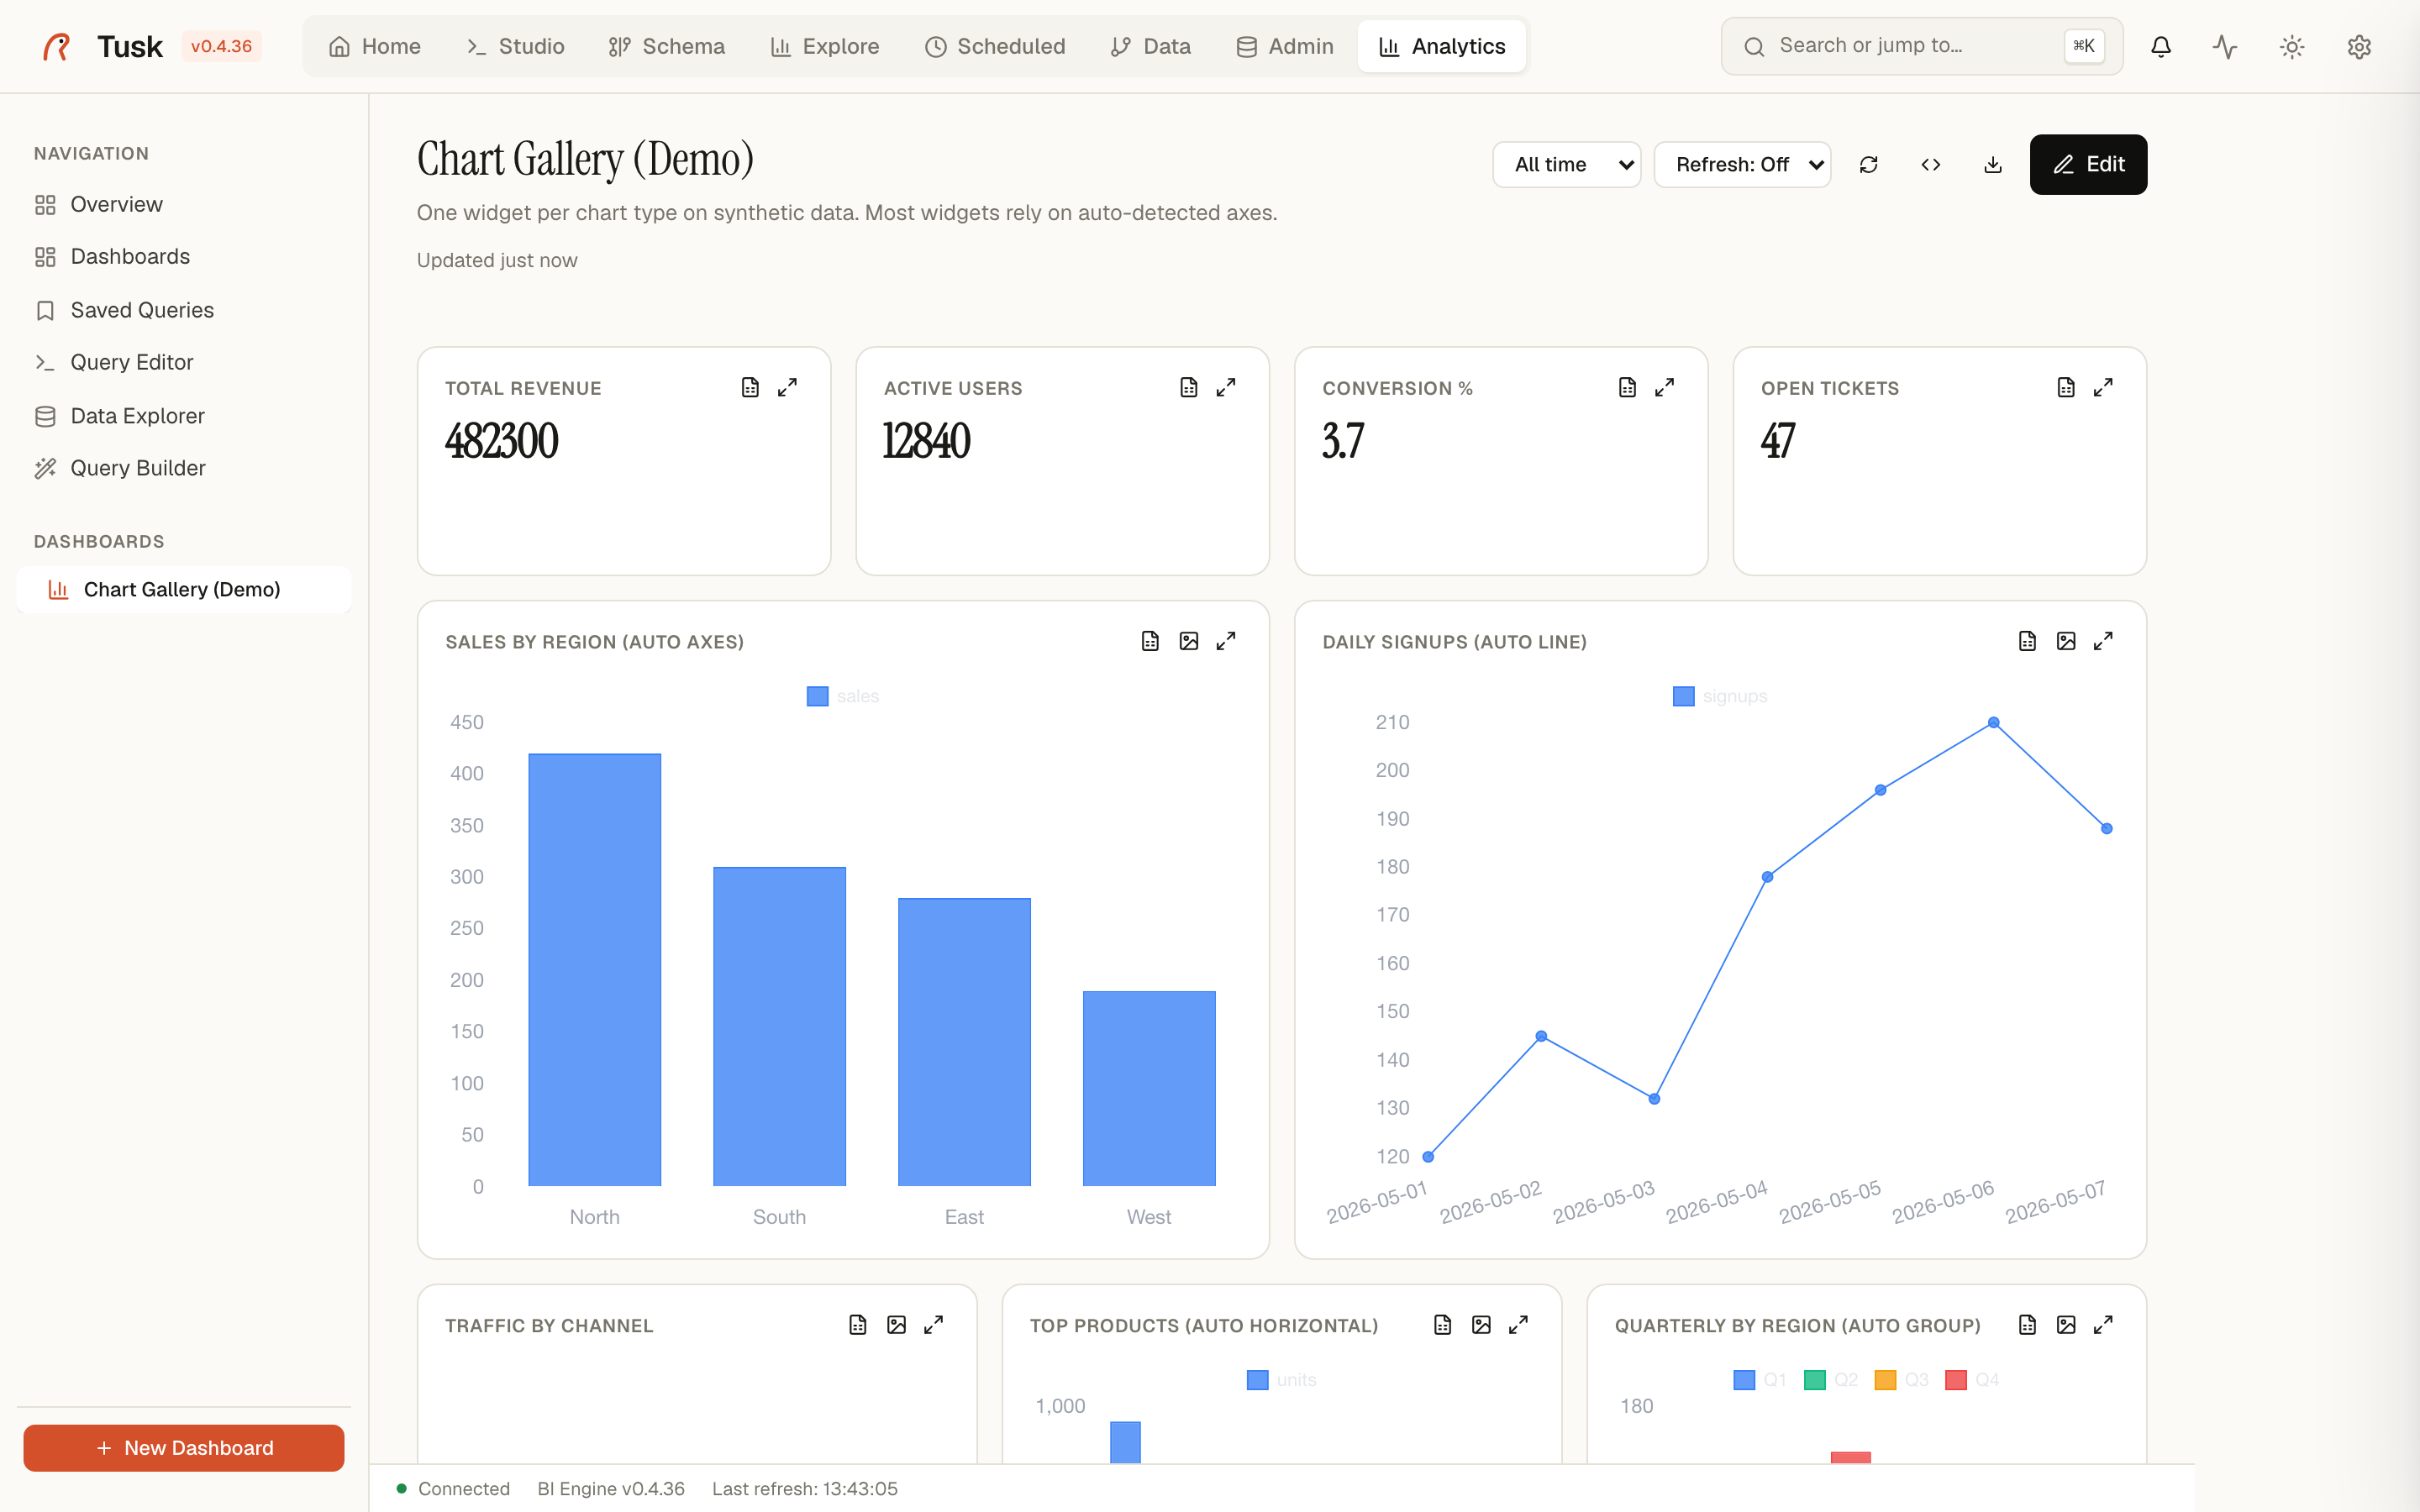
Dashboards, saved queries, data sources, scheduled snapshots, embed tokens. The BI side of Tusk lives here. Built into TuskData since 0.4.36 (it started life as the tusk-bi plugin; nothing to install).
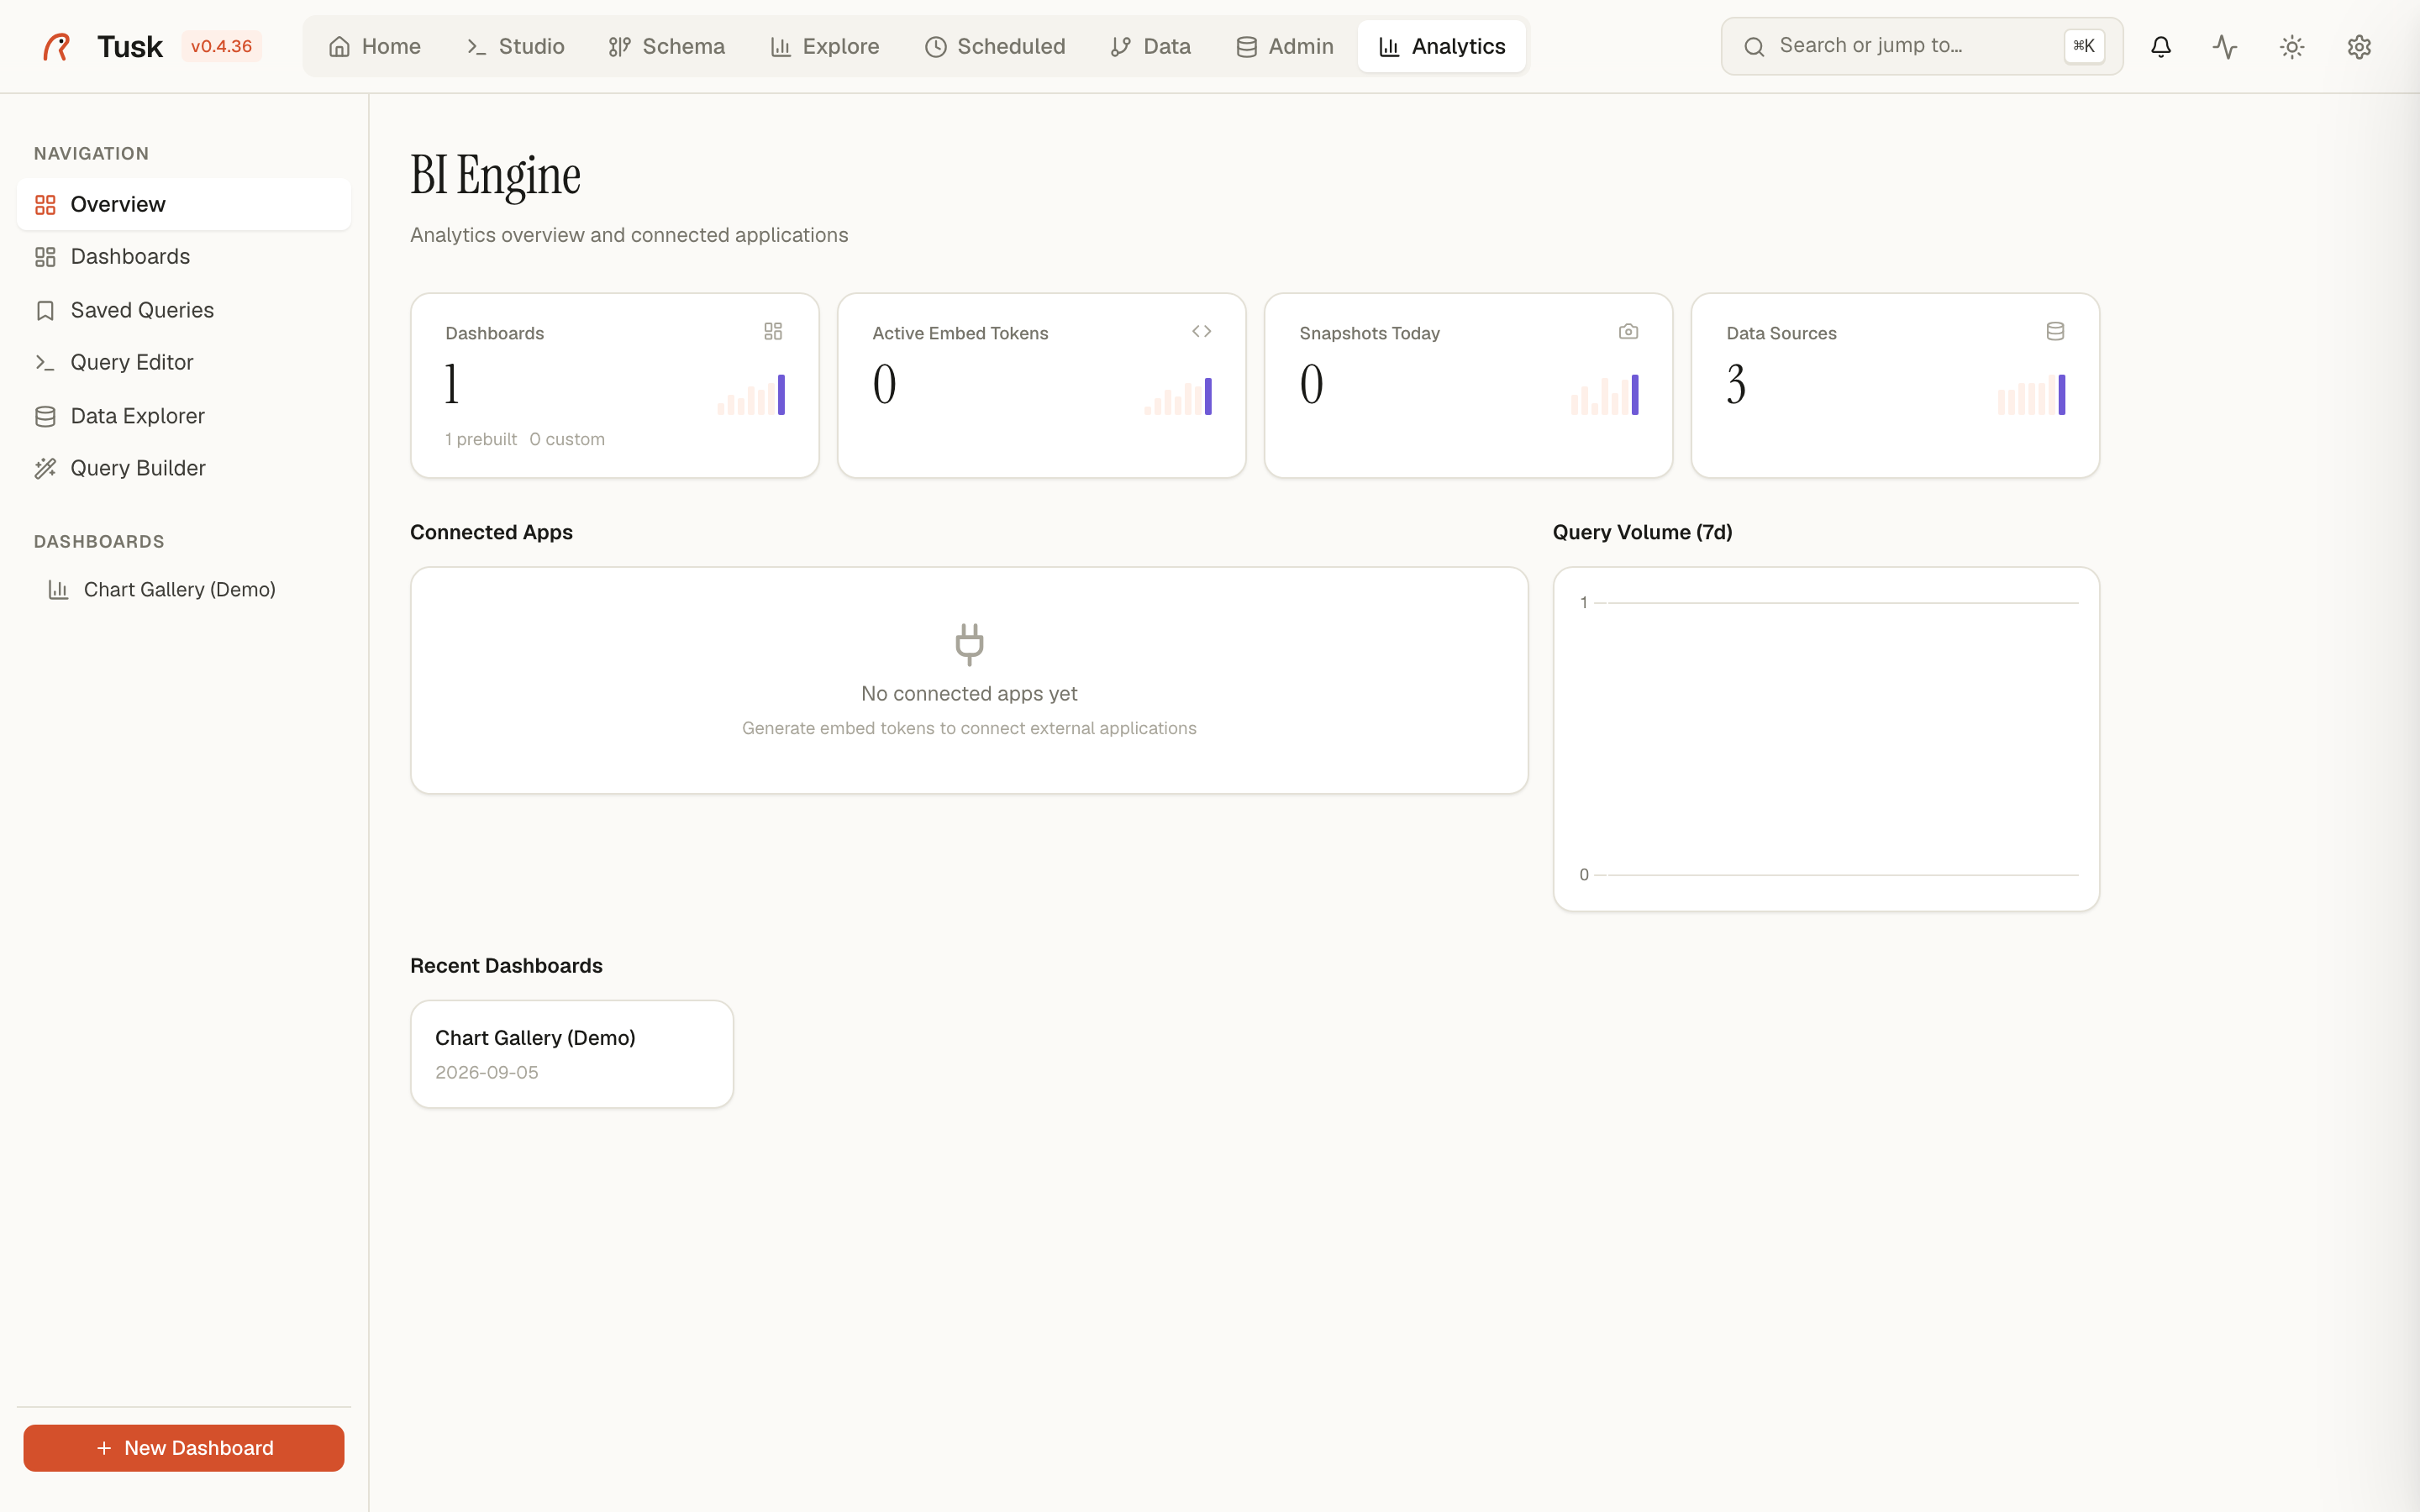
Analytics — BI Engine overview with dashboards and embed tokens.
Layout
A sidebar nav + a content area:
NAVIGATION
─ Overview         ← you are here
─ Dashboards
─ Saved Queries
─ Query Editor
─ Data Explorer
─ Query Builder

DASHBOARDS
─ Cluster Monitor      (prebuilt)
─ Security Overview    (prebuilt)
─ <your dashboards>
+ New Dashboard at the bottom of the sidebar.
Overview page
Four KPI tiles + two charts + a recent-dashboards strip:
| Tile | What it counts |
|---|---|
| Dashboards | Total dashboards in this Tusk instance, with a count of prebuilt vs custom |
| Active Embed Tokens | Live embed_tokens rows that haven't expired |
| Snapshots Today | Scheduled-query result snapshots produced in the last 24h |
| Data Sources | Registered data sources (Postgres connections + DuckDB + any plugin-exposed dataset) |
Below the tiles:
- Connected Apps: empty state when no embed tokens have been issued. Once you generate one, this fills with cards for each consuming app.
- Query Volume (7d): line chart of queries run through the BI engine across the last week.
- Recent Dashboards: clickable cards for the dashboards you've touched most recently.
Dashboards
The viewer + editor for individual dashboards. Two layouts:
- Editor: GridStack-based drag/resize, three-panel UI (widget library · canvas · widget config). Used when you're building.
- Viewer: CSS-grid based static layout. Lightweight, no GridStack JS load. What end users see.
A dashboard is a JSON document (exportable / re-importable). Each widget has:
- A widget type:
stat·chart·table·pivot·top_n·funnel·map·text - A SQL query (or reference to a saved query)
- A size in the 12-column grid (
span-3tospan-12) - An optional filter set (dropdowns / date range / text) that scopes the query
Header chrome (the v0.3.0 redesign):
- Title (serif font)
- Description
- Last-updated meta + Live badge (when
refresh_interval_seconds > 0) + Public badge (whenis_public = true) - Filter dropdown · Refresh · Embed · Export · Edit
Widget types
| Type | Data shape | Use when |
|---|---|---|
| stat | SELECT <number> (1 row, 1 column) |
MRR, active users, single-metric KPI. Sparkline auto-derived from snapshot history. |
| chart | SELECT label, value [, group] |
Line / bar / area / donut. Auto-picks based on x-axis type. |
| table | Any | Sortable result table with conditional formatting rules. |
| pivot | SELECT row_dim, col_dim, value |
Pivot cross-tab with sum / avg / count aggregation. |
| top_n | SELECT label, value |
Horizontal bar list — top countries, top products, top users. |
| funnel | SELECT stage, count ordered DESC |
Conversion / step drop-off — pipeline funnel, signup funnel. |
| map | SELECT lat, lng [, value, label] |
MapLibre point map; map_style: 'bubbles' sizes circles by value with inline labels. |
| text | (none) | Markdown notes, section headers. |
Data sources
The Data Sources page (under the sidebar nav) lists everything BI can query against:
- Every Postgres connection registered in the main Tusk app.
- The local DuckDB engine.
- Any plugin-exposed dataset — e.g. tusk-cluster's worker stats. Plugins declare their datasets via
TuskPlugin.get_datasets()and they appear here automatically.
You can run a query against any data source from the Query Editor / Query Builder.
Saved queries
Reusable SQL templates. Each saved query has:
- Name + description
- The source it runs against
- The SQL body
- An optional chart config (so re-running automatically re-charts)
- An optional schedule (cron expression — the result becomes a
snapshotrow, feeding stat-widget sparklines and freshness badges)
Embed tokens
Generate a short-lived token to embed a dashboard into an external app via iframe. Each token carries:
- Dashboard ID to render
app_id(free-form, just for tracking who issued it)expires_in_secondsrls_clauses— a{column: value}map that scopes every query the embed runs (e.g.{"tenant_id": "42"}makes the dashboard show only tenant 42's data)
Use case: a SaaS product giving each of its customers a "their data" dashboard. You issue a token per session, customer sees only their rows.
Embedding stays at this level on purpose: an iframe and a token. There is no React/Vue SDK and none is planned.
Dashboards as files
tusk bi export all --out dashboards/     # one YAML per dashboard: widgets + queries
tusk bi import dashboards/*.yaml         # replaces a dashboard with the same name
Keep them in git, review changes, apply on a fresh instance. --json
writes JSON instead; both formats are what the dashboard export endpoint
returns.
Why Analytics matters
Most data tools treat dashboards as the end of the workflow: build, share, done. Tusk treats them as just another view alongside Studio (raw SQL) and Explore (auto-profile). The same query you write in Studio becomes a widget here; the same connection you use for admin powers the dashboard. One product, one mental model.
Related
- studio.md — write the SQL once here, save it, embed it as a widget there.
- explore.md — confirm a column shape before wiring it into a widget.
- How and why it moved into core:
specs/roadmap/later/tusk-bi-to-core.md.